a Stop TB and Leprosy Elimination, Division of Combating Communicable Diseases, World Health Organization Regional Office for the Western Pacific, Manila, Philippines
Correspondence to Tom Hiatt (e-mail: hiattt@wpro.who.int).
To cite this article:
Hiatt T and Nishikiori N. Epidemiology and control of tuberculosis in the Western Pacific Region: analysis of 2012 case notifcation data. Western Pacific Surveillance and Response Journal, 2014, 5(1):25–34. doi:10.5365/wpsar.2014.5.1.013
Tuberculosis (TB) control in the World Health Organization (WHO) Western Pacific Region has seen substantial progress in the last decade, with a 33% reduction in prevalent TB cases since 2000. The burden remains immense, however, and national TB programmes must evolve and adapt to build upon these gains. Through routine surveillance, countries and areas in the Region reported 1.4 million TB cases in 2012. The case notification rate increased in the early 2000s, appears to have stabilized in recent years and is in decline for all forms and new smear-positive cases. The age and sex breakdown for smear-positive TB case rates by country shows generally higher rates with increased age and declining rates over time for all age groups. Treatment success remains high in the Region, with 15 countries reaching or maintaining an 85% success rate. HIV testing among TB patients has increased gradually along with a slow decline in the number of HIV-positive patients found.
The trend of TB notification is heavily influenced by programmatic improvements in many countries and rapidly changing demographics. It appears that cases are being found earlier as reflected in declining rates of smear-positive TB and steady rates of TB in all forms. WHO estimates depict a decline in TB incidence in the Region. HIV testing, while still low, has increased substantially in recent years, with essential TB/HIV services expanding in many countries.
TB surveillance data, within inherent limitations, is an important source of programmatic and epidemiological information. Careful interpretation of these findings can provide useful insight for programmatic decision-making.
Significant progress has been made in tuberculosis (TB) control in the World Health Organization (WHO) Western Pacific Region especially in the past decade. The number of prevalent TB patients in the Region fell from 3.6 million in 2000 to 2.4 million in 2012.1 During the same period, over 10 million patients were diagnosed and treated, and an estimated 800 000 deaths were averted.2 According to the latest WHO estimates, the Region is on track for achieving the TB-related Millennium Development Goals (MDGs) and other international targets by 2015. However, with 1.4 million TB patients notified annually in the Region and several countries with a persistent substantial disease burden, TB control policies and strategies require continuous evolution to adopt new tools and approaches as well as to address emerging challenges faced by national TB control programmes. In light of the MDG target date approaching, WHO has embarked on an extensive consultative process of developing a new global TB strategy after 2015.3 At this critical period of strategy renewal, a thorough analysis of surveillance data provides valuable information on the current epidemiological situation, programmatic progress and future directions.
Throughout the year of 2014 and beyond, we plan to conduct a series of further regional analyses on various topics such as subnational data analysis and utilization, the situation of drug-resistant TB, contact investigation and other forms of TB screening activities to stimulate the utilization of surveillance data for informed programme decision-making.
Every year, 36 countries and areas in the Region are requested to report TB surveillance data to WHO using a standardized data collection form. Since 2009, a web-based online system has been used for data submission and validation. Collected data cover the following areas: TB case notifications and treatment outcomes, diagnostic and treatment services, drug management, surveillance and surveys of drug resistance, information on TB/HIV co-infection, infection control, engagement of all care providers and budgets and expenditures for TB control. The full description of methods is available in the Global Tuberculosis Report 2013 and the data sets are available from the WHO global TB database (www.who.int/tb/country/en/). Case definitions for TB can be found in the 4th edition of the TB treatment guidelines.4 In 2013, 30 countries and areas of the Western Pacific Region reported data representing more than 99.9% of the total population. This report described the epidemiological situation and progress in programmatic response with a focus on seven countries with a high burden of TB: Cambodia, China, the Lao People’s Democratic Republic, Mongolia, Papua New Guinea, the Philippines and Viet Nam. (Globally, WHO designates 22 countries including Cambodia, China, the Philippines and Viet Nam with a high burden of TB. The other three countries – the Lao People’s Democratic Republic, Mongolia and Papua New Guinea – are considered priority countries with a high burden of TB in the Western Pacific Region).
Analysis was conducted by the statistical package R (R Core Team, 2013, Vienna, Austria, www.R-project.org). Due to calls for transparent and reproducible research,5,6 we have published programme code to generate the entire contents of this article including all figures and tables by using R with the knitr package (Yihui Xie, 2013). Readers can request a copy of the code and reproduce all figures and tables under an appropriate personal computing environment. For non-commercial purposes, readers may modify the code to produce figures and tables that are not presented in this article. For instance, readers may wish to produce tables and figures for countries or regions other than the WHO Western Pacific Region.
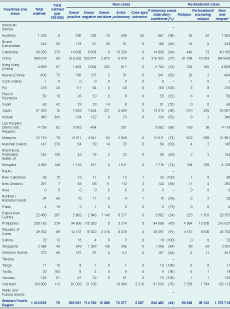
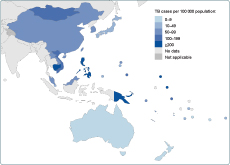
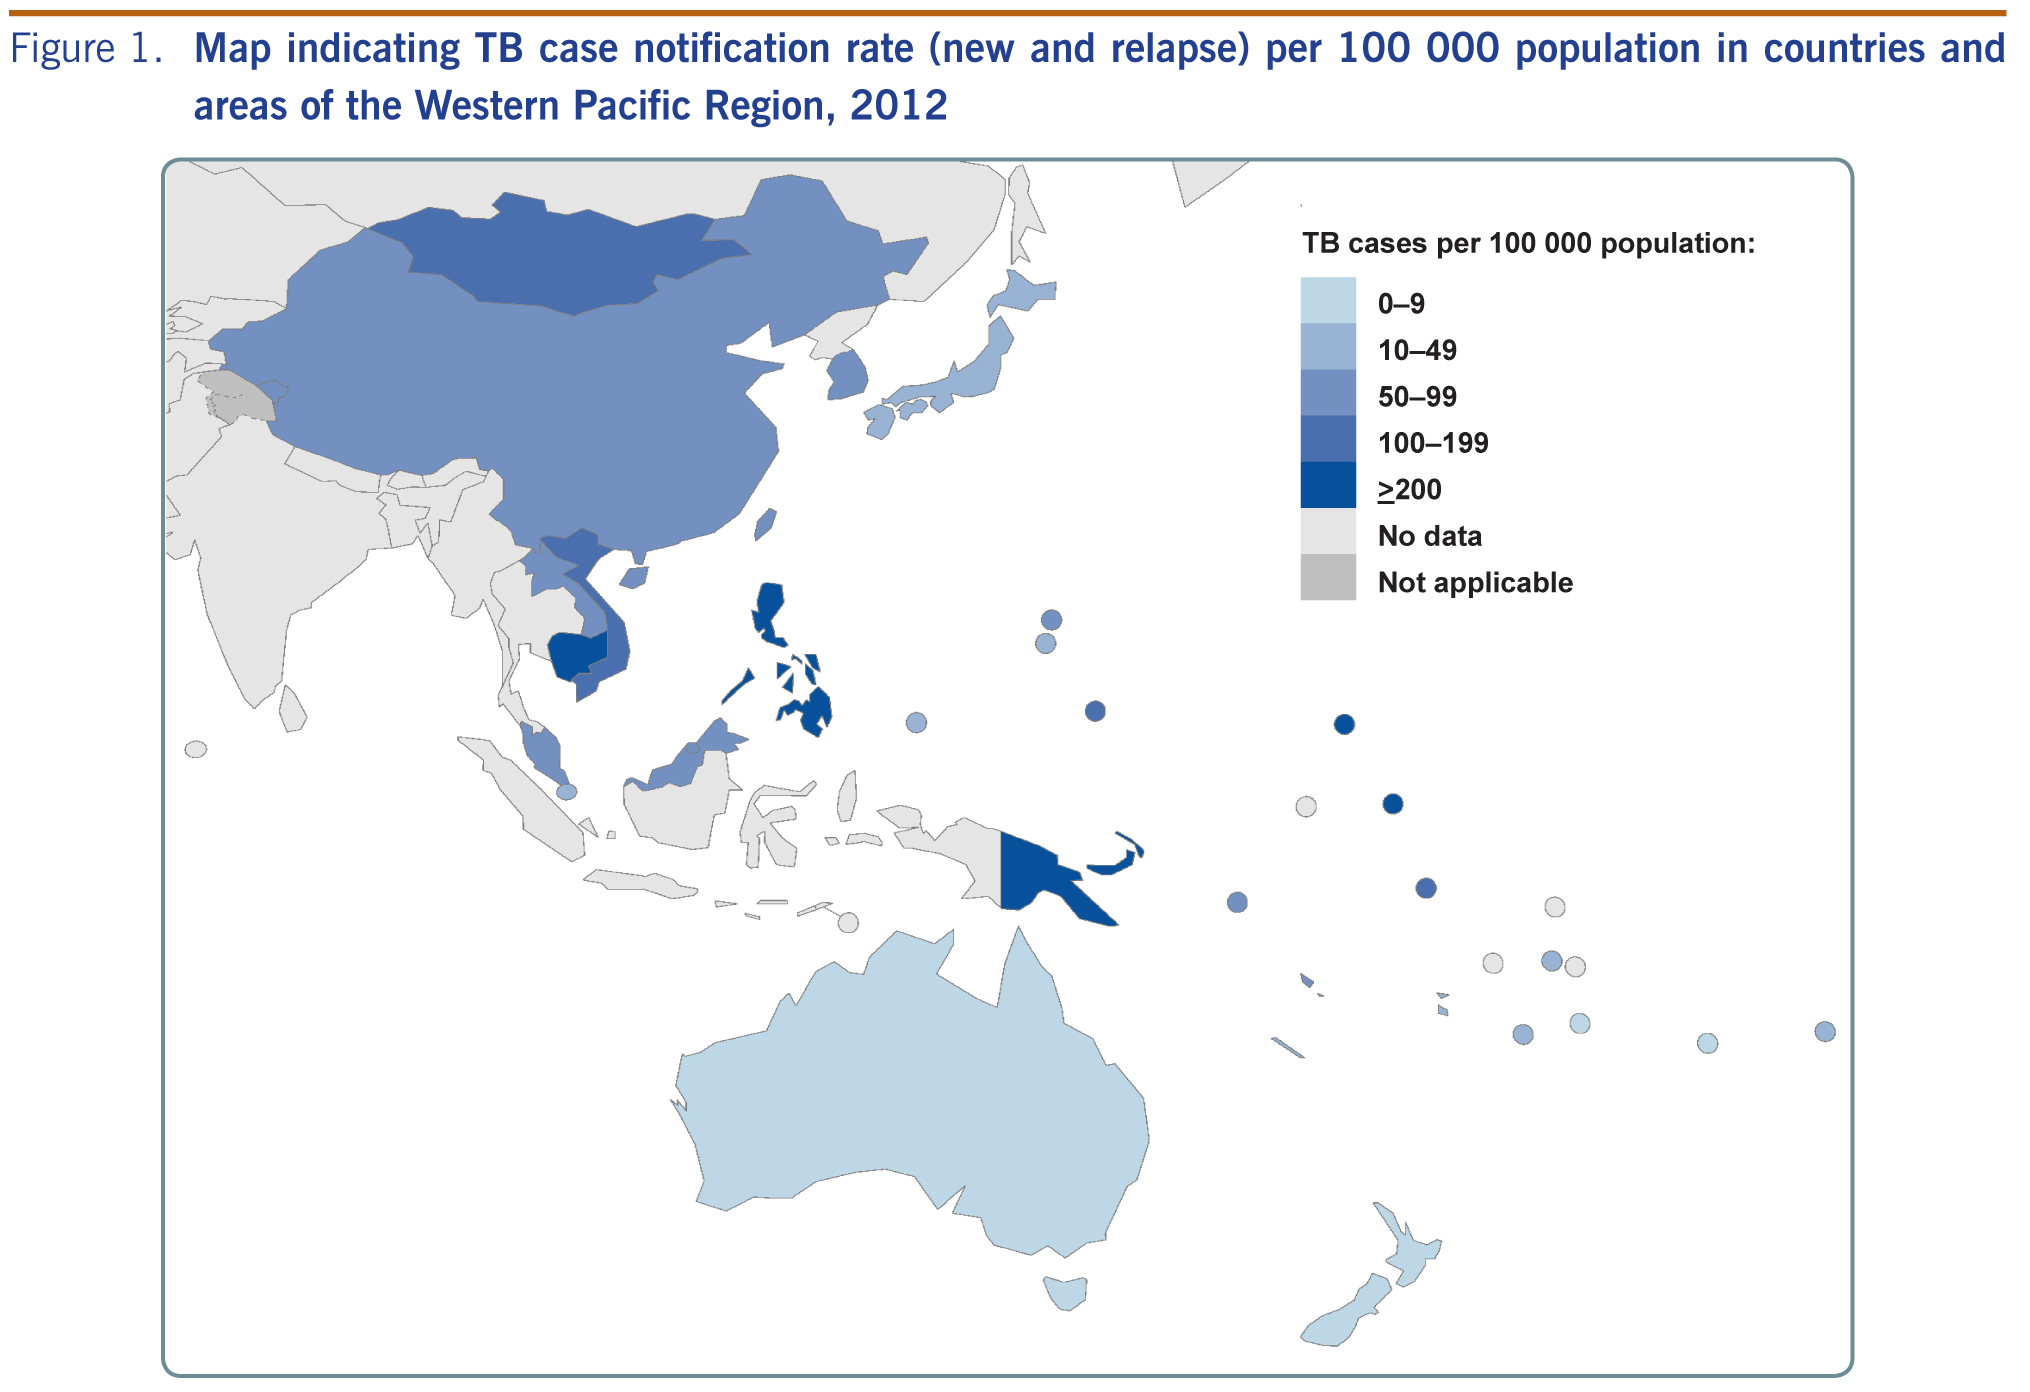
In 2012, countries and areas in the Region reported 1 410 835 people with TB disease (Table 1), making up 23% of the global burden.1 Of these cases, 97.5% (1 375 713) were new episodes of TB disease (either new or relapse cases). Within the Region, China accounts for 64% (900 678) of the caseload, with the Philippines and Viet Nam following with 16% (230 162) and 7% (103 906), respectively. TB notification rates, expressed as cases per 100 000 population, vary substantially in the Region, with the highest rates found in Kiribati, Papua New Guinea, the Marshall Islands, Cambodia and the Philippines (343, 287, 276, 270 and 224 per 100 000 population, respectively [Figure 1, Table 1]).
Blank cells indicate data not reported; “–” indicates values that cannot be calculated.
* New and relapse – includes cases for which the treatment history is unknown.
Note: Data reported as of 1 October 2013.
Between 2002 and 2007, case notification rates in the Region increased from 47 to 77 per 100 000 population in all forms of TB and from 22 to 38 per 100 000 population in new smear-positive TB cases. After 2005, the case notification rates for all forms of TB stabilized, and new smear-positive cases seem to have started to decrease (Figure 2).
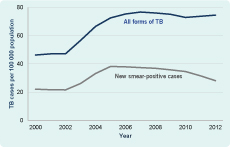
Figure 3 shows age- and sex-specific case notification rates of new smear-positive cases for the seven countries with a high burden of TB in the Region (note that the scale of the vertical axis is different for each country). Many countries follow a typical pattern for cross-sectional observations with increasing notification rates towards older populations except Mongolia and Papua New Guinea. In general, males are more affected than females, with male-to-female TB ratios 3:1 in Viet Nam.
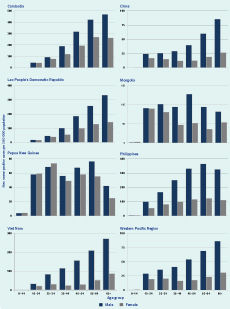
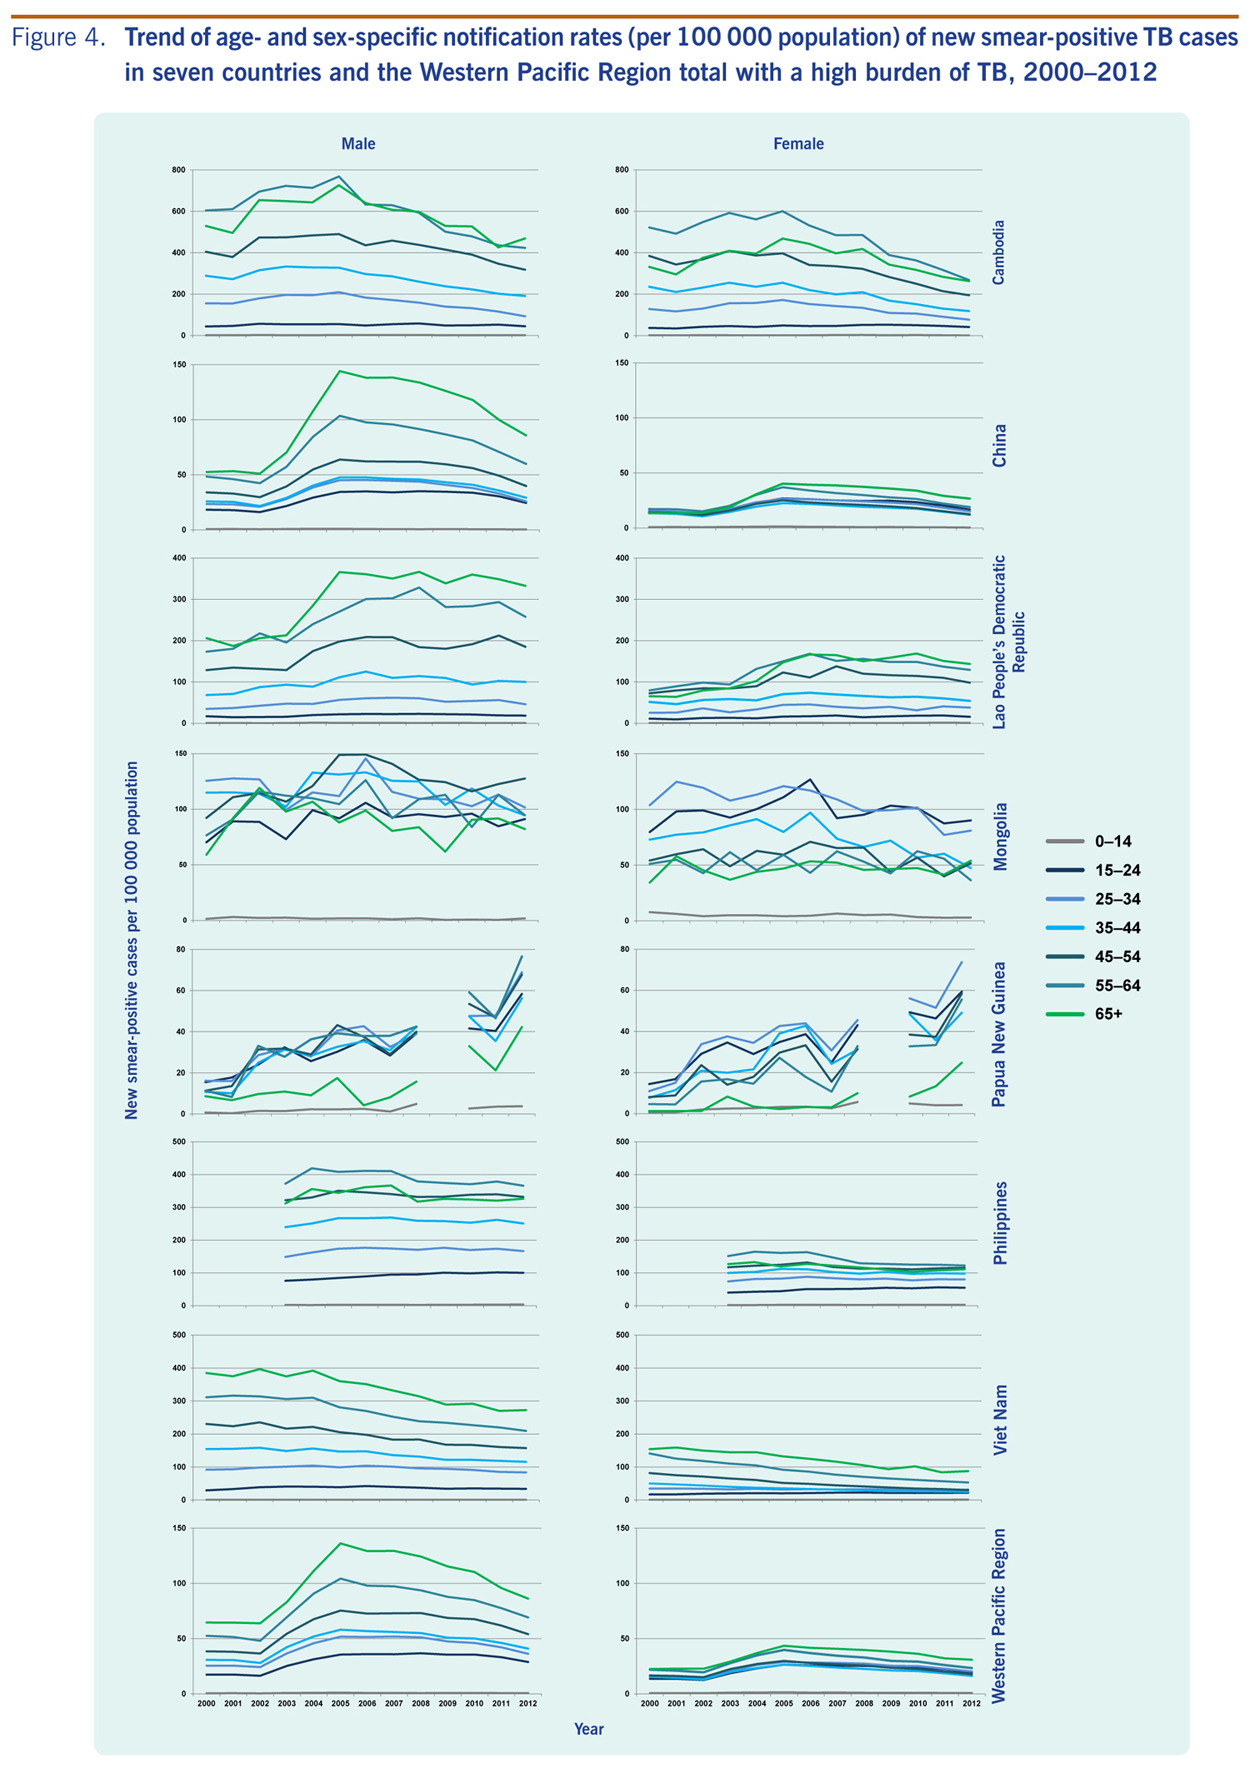
Figure 4 shows trends of notification rates of new smear-positive cases of age- and sex-specific groups in the seven countries with a high burden of TB from 2000 to 2012. Some countries such as Cambodia, China and Viet Nam demonstrated a declining trend of case notification for almost all age- and sex- groups, while others showed a less apparent trend. Papua New Guinea showed a sharply increasing trend.

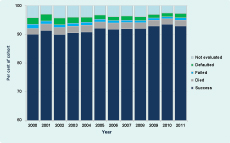
The Region continued observing treatment success rates beyond the target of 85% (Figure 5), and the rate has been at 85% or higher over the past several years. Across the Region, 15 countries and areas reached or maintained the 85% treatment success target. Among the countries with a high burden of TB, the treatment success rate was highest in China (96%), followed by Cambodia (94%), Viet Nam (93%), the Lao People’s Democratic Republic (92%), the Philippines (90%) and Mongolia (85%). The treatment success rate of Papua New Guinea was the lowest at 69%, with approximately a quarter of the 2011 cohort either defaulted or not evaluated.
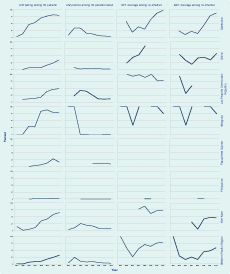
There has been some progress in reporting of information on TB/HIV co-infection and collaborative activities in the last several years. Figure 6 summarizes four basic indicators (HIV testing, HIV positivity rate, co-trimoxazole preventive therapy [CPT] coverage and antiretroviral therapy [ART] coverage) for the seven countries with a high burden of TB. Cambodia reported the most comprehensive data completeness and programmatic progress. The coverage of HIV testing, CPT and ART progressively increased with a steady decrease in the proportion of HIV-positive individuals among TB patients.
Overall, in 2012, countries and areas of the Western Pacific Region reported 1.4 million TB cases (all forms) and a case notification rate of 75 per 100 000 population, a level similar to the past several years.
It has been known that the rapid increase in case notification between 2002 and 2007 was due to several positive programmatic developments in many countries in the Region such as completion and consolidation of the WHO directly observed treatment, short-course strategy expansion; improvement in case reporting, including electronic reporting systems; and efforts to engage all health-care providers.7 Particularly, renewal of infectious disease-related legislation and the establishment of an Internet-based disease notification system in China made a substantial contribution to the progress.8
Although case notification for all forms of TB appears to have been flat since 2007, it is important to note that the new smear-positive case notification rates demonstrate a clear declining trend (Figure 2). A possible interpretation is that the true TB incidence has been declining while overall case detection has been static because intensified programmatic efforts by national TB programmes for early and increased case detection include smear-negative and extrapulmonary TB. The latest WHO estimates support this explanation, with estimated incidence rates showing a consistent, rapidly declining trend (Figure 7).1

Note: Shaded areas represent uncertainty bands.
In any country where a rapid demographic change is under way, overall notification rates may not reflect a true disease trend in the communities. For instance, an overall case notification trend may appear to be stable because decreasing incidences can be cancelled out by a rapidly increasing proportion of an older population. For this reason, the examination of age- and sex- specific case notification rates is more informative and provides insights for understanding the underlying epidemiological process in a given setting.
The typical pattern of linear increase of notification towards the older populations (such as shown in some countries in Figure 3) has been explained as a widely observed phenomena under a stable TB control situation,9 reflecting a high annual risk of TB infection in the past when the older population was young. Atypical patterns shown for Papua New Guinea and Mongolia, particularly relatively high notification rates among young and female groups, warrant further investigation. Time trend analysis for age- and sex- notification rates (Figure 4) is useful to detect any specific subgroups among which TB transmission and/or disease progression is particularly active.
One of the critical shortcomings of these analyses is a gross lack of morbidity information among small children because the data are limited to smear-positive cases only. Since the 2006 revision of WHO recording and reporting forms,10 the number of countries reporting age- and sex-disaggregated data for smear-negative and extrapulmonary cases has been increasing and will enable a better assessment of the TB burden among children in future analysis.
HIV infection fuels the TB epidemic, particularly in countries and areas with a high burden of TB. The overall percentage of TB patients tested for HIV in the Region still remains low. However, the figure has substantially increased in the last several years, particularly in Cambodia, Viet Nam and the Lao People’s Democratic Republic. Essential services such as co-trimoxazole prophylaxis and isoniazid preventive therapy have also expanded in many countries in the Region.
This report provides a snapshot of the epidemiological and programmatic situation of TB in the Western Pacific Region based on case notification data in 2012. As for any disease surveillance system, the analysis of surveillance data has inherent limitations. TB surveillance covers populations served by care providers linked with the national TB programme. Ideally this would include all known cases in the country; in practice the proportion of cases diagnosed outside of the TB programme and included in national reporting varies depending on the legal framework in the country. The WHO TB Impact Measurement Task Force recommends that countries continuously improve surveillance systems until reported cases can be considered a reliable proxy for incidence.11 A careful assessment is needed of programmatic progress in the country and the quality of surveillance data when interpreting these findings.
TB surveillance continues to be an important source of information for assessing the situation and measuring the progress for decision-making. The WHO Regional Office for the Western Pacific will continue to conduct regional analysis on various topics related to TB epidemiology and programmatic progress, as well as provide support to countries to conduct epidemiological and programmatic assessment at national and subnational levels.
None declared.
None.
The graph for Figure 5 was corrected on 16 June 2014.